Tracing
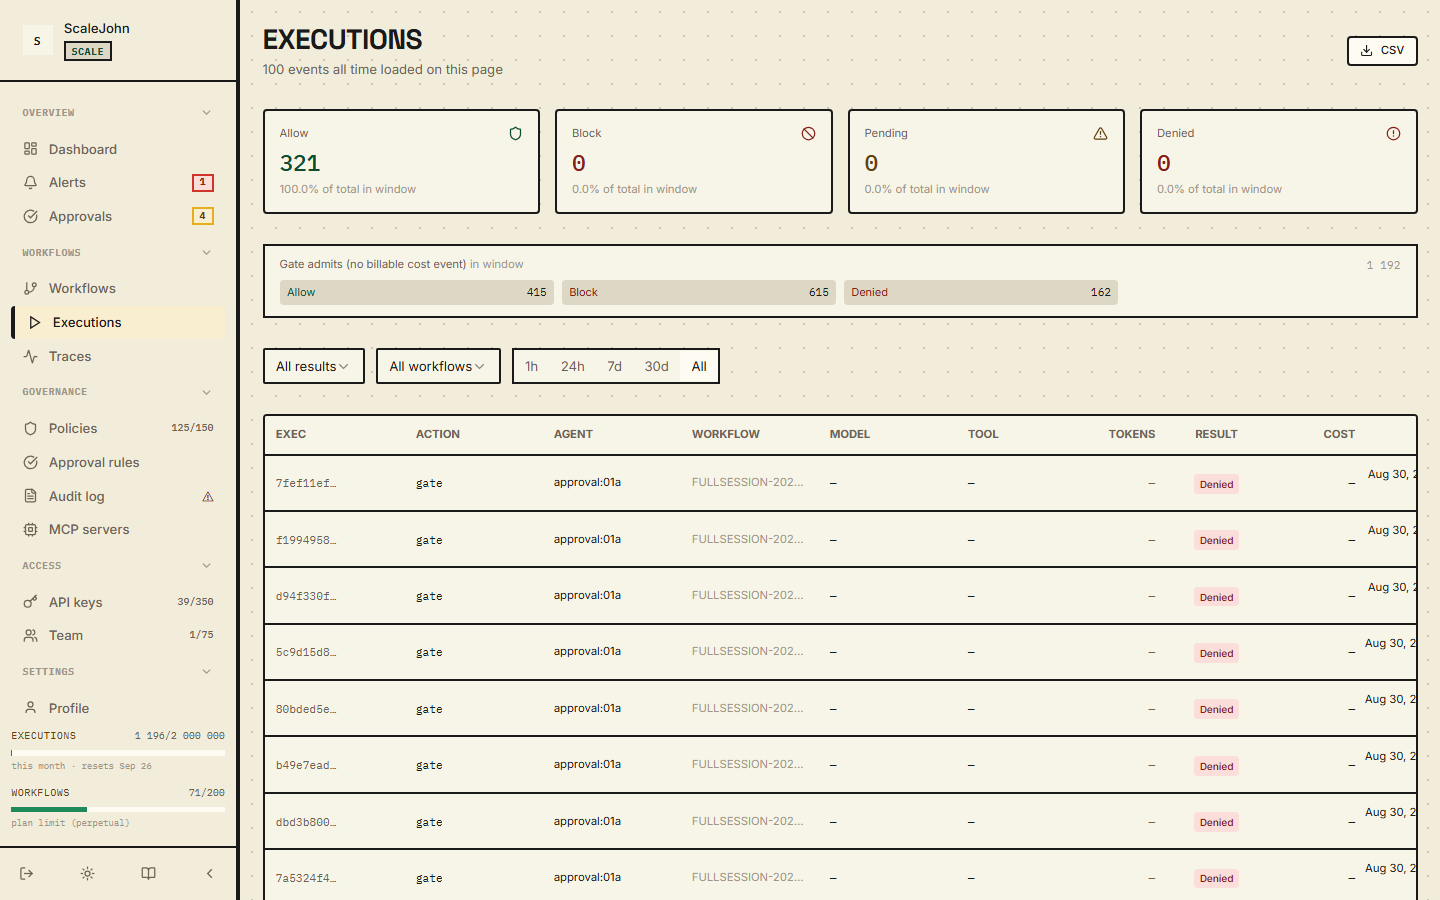
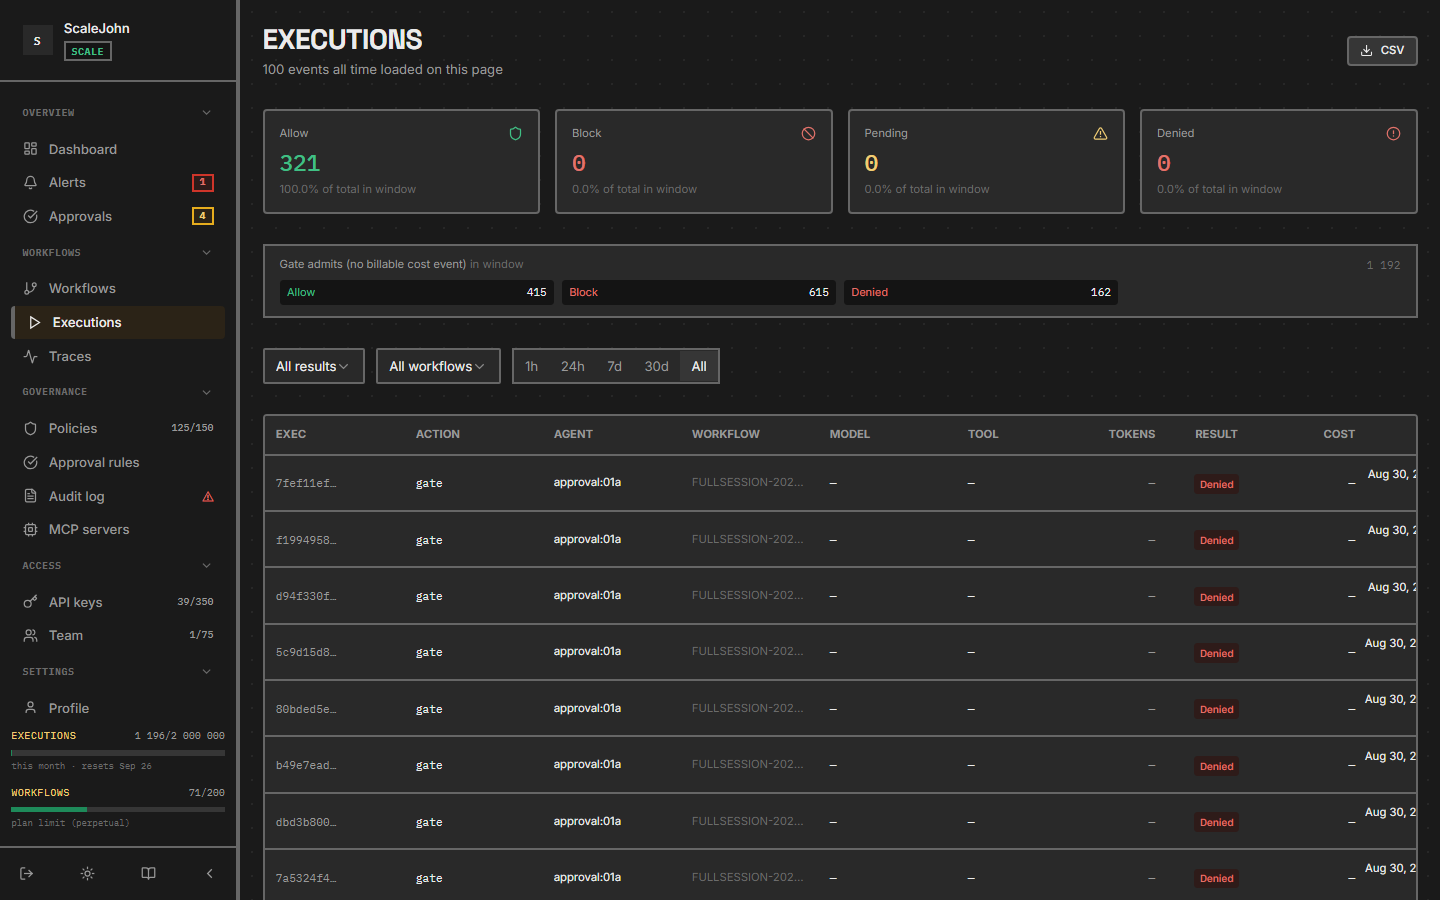
A trace is everything that happened during one run of your agent. In the dashboard they live under Executions and Traces in the sidebar. Each execution is one agent run; the trace view shows the nested structure of every LLM call, every tool call, and how long each took.
If a user reports "the agent did something weird at 14:30", the tracing tab is where you go to see exactly what happened.
What you see in the dashboard
The Executions page lists every agent run. Each row shows:
- Workflow — which workflow ran this
- Started at — timestamp
- Duration — total run time
- Status — completed / failed / killed
- Cost — total cost for this run
- LLM calls — how many LLM invocations
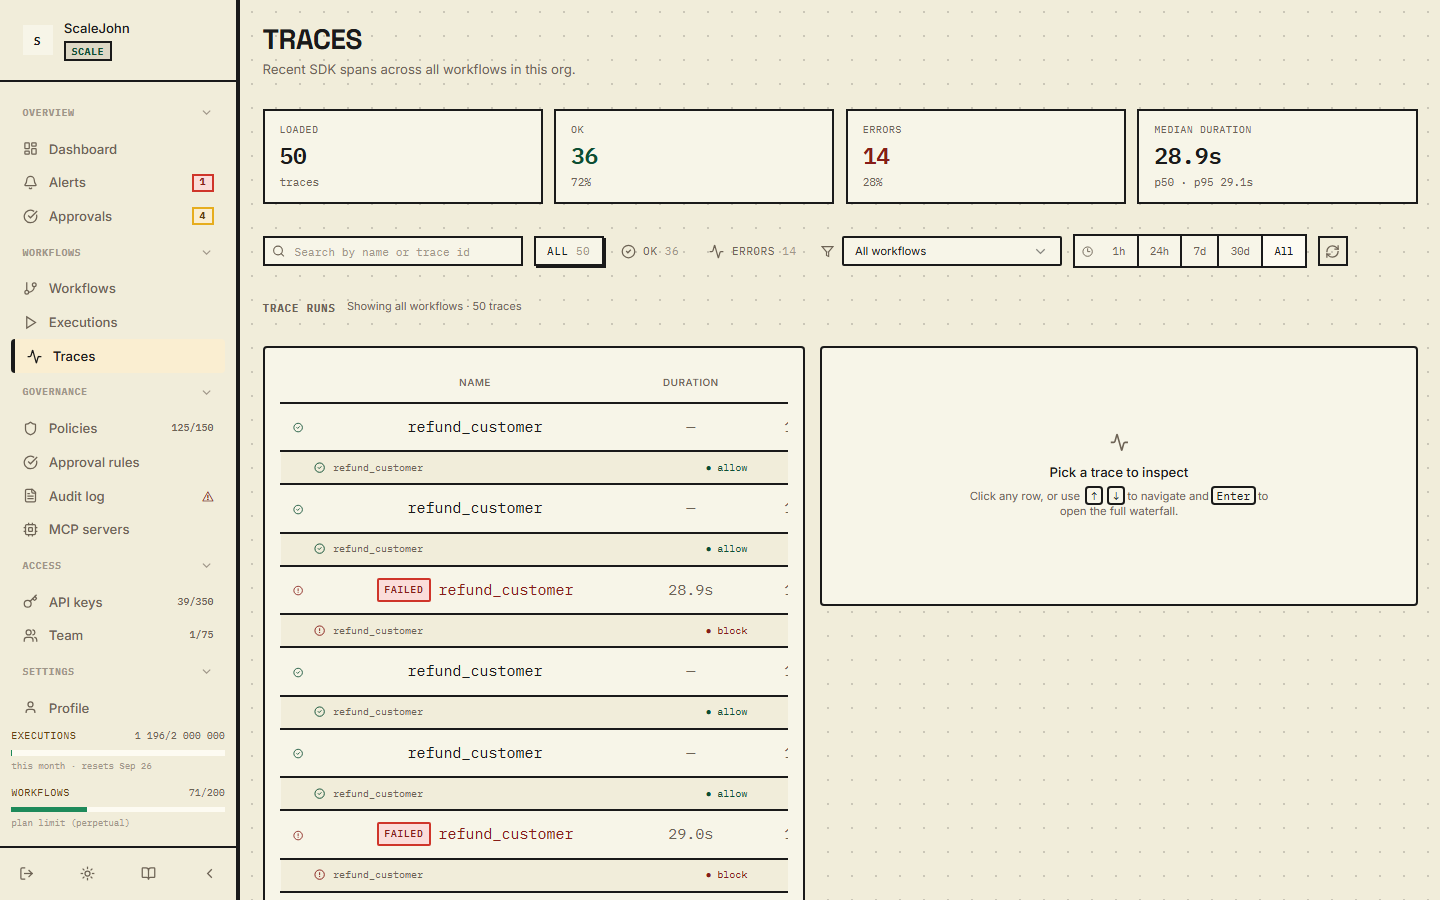
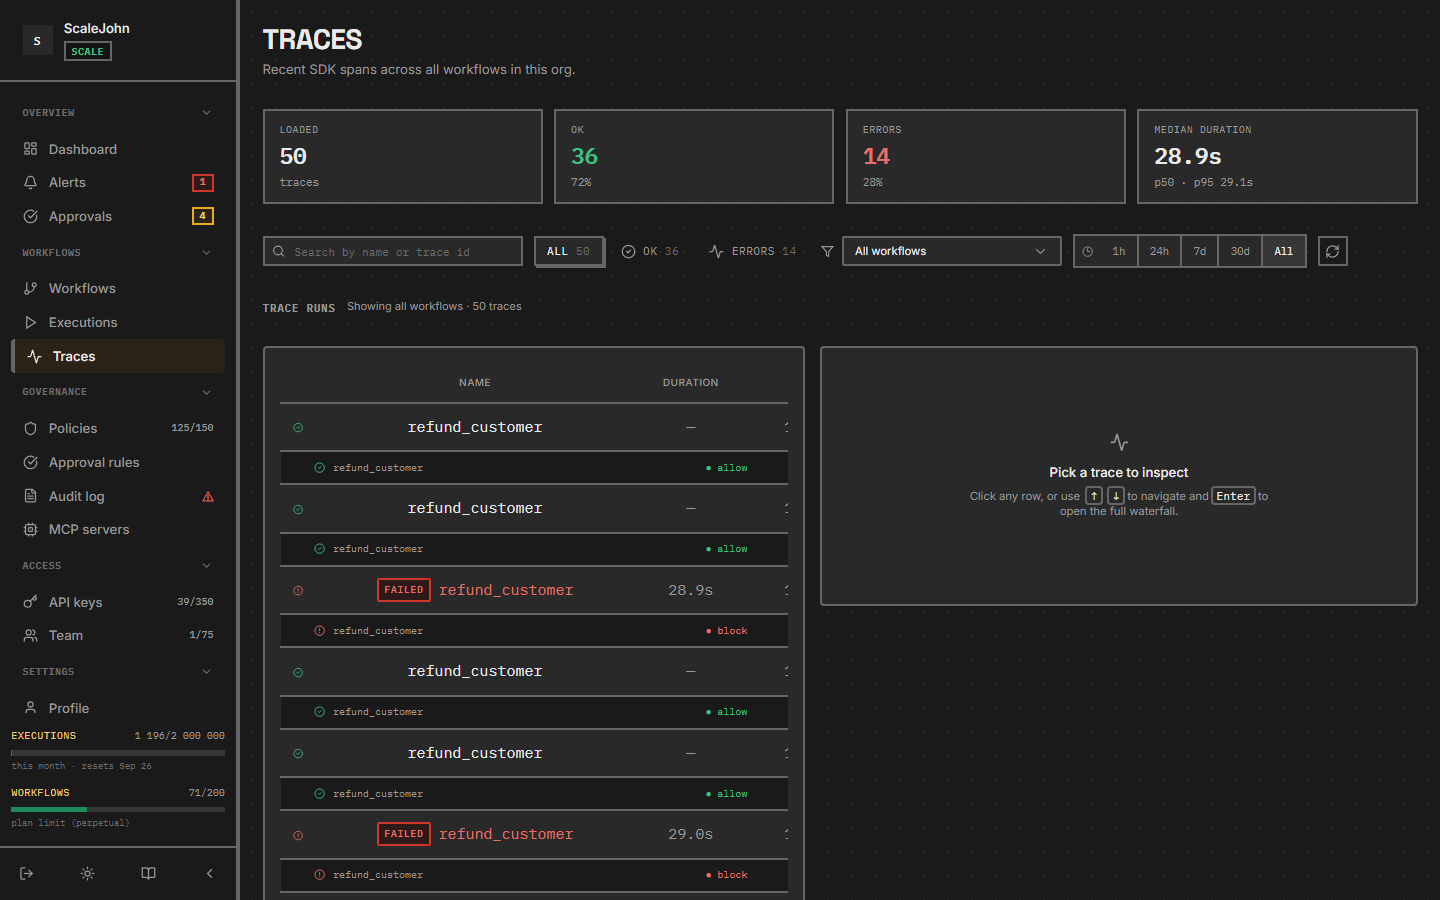
Click an execution to open the Trace view. The trace is a hierarchical tree:
Run "user-123-research"     2m 14s   $0.42
├─ Step 1: plan             0.3s    $0.01
│  └─ llm.call (claude-sonnet-4-5)    0.3s    $0.01
├─ Step 2: research         45s     $0.18
│  ├─ llm.call (claude-sonnet-4-5)    12s     $0.06
│  ├─ tool.call (tavily_search)       8s      —
│  └─ llm.call (claude-sonnet-4-5)    22s     $0.12
├─ Step 3: write             30s     $0.12
│  └─ llm.call (claude-sonnet-4-5)    30s     $0.12
└─ Step 4: review            17s     $0.11
   └─ llm.call (claude-sonnet-4-5)    17s     $0.11
Three things you can read off this tree at a glance:
- Where the time went — the longest step is where to optimise.
- Where the money went — same, but for cost.
- What the agent did — each tool call and LLM call is clickable, showing the full request/response.
How a trace is built
When you use the SDK's @protect decorator or with workflow(...)
context manager, the SDK automatically creates spans:
| Action | What gets a span |
|---|---|
@protect decorator |
One span per gate call |
with workflow("name"): |
One span for the whole workflow run |
with chain("id"): |
One span for the chain |
with span("phase"): |
One span for the named phase |
You don't have to add tracing manually — it comes from the
decorators and context managers you already use. The SDK sends
trace metadata alongside every /gate and /track call.
For nested agent orchestrations (a supervisor calling sub-agents), each sub-agent's spans are nested under the supervisor's. The trace view shows the tree; the Cost column rolls up automatically.
What each span contains
Click any span in the trace tree to see:
- Span ID — unique identifier (UUID)
- Parent span ID — for nesting
- Started at / Duration — timing
- Status — completed / failed / killed
- Inputs — the prompt metadata sent to the LLM (truncated if huge). Prompt content is NOT stored — NullRun never persists raw prompt text or LLM response bodies. See Audit records → What is NOT stored.
- Outputs — the LLM's response metadata (token counts, model, finish reason). Raw completions are NOT stored.
- Cost — input + output tokens × model rate
- Tool calls — every tool the span invoked (with arguments)
- Decision — the gate verdict (
allow/block/require_approval) and which policy triggered it
For blocked calls, the Decision row is the most useful — it links to the policy that matched and shows the rule.
How long traces are kept
Trace retention follows your plan's history_days window:
| Plan | Trace retention |
|---|---|
| Lite | 3 days |
| Starter | 7 days |
| Growth | 30 days |
| Scale | 90 days |
| Enterprise | unlimited |
After the retention window expires, the trace is removed from the dashboard; the aggregated cost information stays (it's summarised per workflow per period).
If you need longer retention for compliance, you can export traces from the dashboard as JSON via the Export button on the Executions page. The exported shape matches the wire format.
Span identifiers and correlation
Each span has three identifiers:
| Field | Purpose |
|---|---|
trace_id |
The whole agent run — same across every span in one execution |
span_id |
One call — unique per @protect invocation |
parent_trace_id |
For sub-agents — the orchestration trace they belong to |
You can search the dashboard by any of these. If a customer reports
a problem with trace_id = abc-123, you can pull the full trace and
every decision tied to it from the audit log.
How to use tracing during development
When you're building a new agent, traces tell you:
- Is the agent slow? — sort by duration, see which LLM call takes the most time.
- Is the agent hitting the budget? — look for spans with
decision = block / NR-B004. - Is the agent calling tools you didn't expect? — the trace shows every tool call with arguments.
When you're debugging a production issue, traces answer:
- What did the agent do at 14:30 yesterday? — filter by time range, click each execution, walk the trace.
- Why did the call to
send_emailfail? — the trace shows the call's status and decision. If it was blocked, the linked policy explains why. - How much did this single run cost? — the top of the trace shows the total; the leaves show the per-call breakdown.
Common questions
"My trace shows nothing"
If init() was never called or the API key is missing, the SDK
runs in error mode and no spans are recorded. Check the SDK logs for
NullRunAuthenticationError.
"My trace is incomplete — only some spans show up"
The SDK buffers events and flushes on a timer. If your process
crashes before the flush, the in-flight spans are lost. Use
nullrun.shutdown(flush=True) in your finally block to ensure
everything reaches the gateway.
"Why are some spans duplicated?"
The SDK's auto-instrumentation emits one span per LLM call. If you
also call track_llm manually for the same call, you'll see two
spans. Pick one or the other — the auto-instrumentation is enough for
the standard OpenAI / Anthropic / Gemini / Cohere clients.
See also
- Workflow context — how
workflow()scopes spans - Error handling — errors that span blocks
- Reference → SDK API → track_* — manual span creation